Production
Platform Concerns
- Security, privacy
- Durability
- Performance, Availability
- Easy to operate (minimize burden on production support teams)
- Debugging in production
- Cost
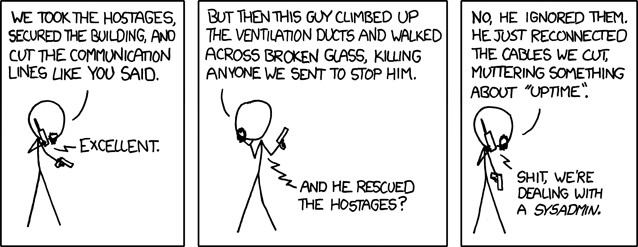
2 primary concerns for an operations team: uptime (availability), cost - Rob Brown
Mikey Dickerson’s Ops Priority Pyramid
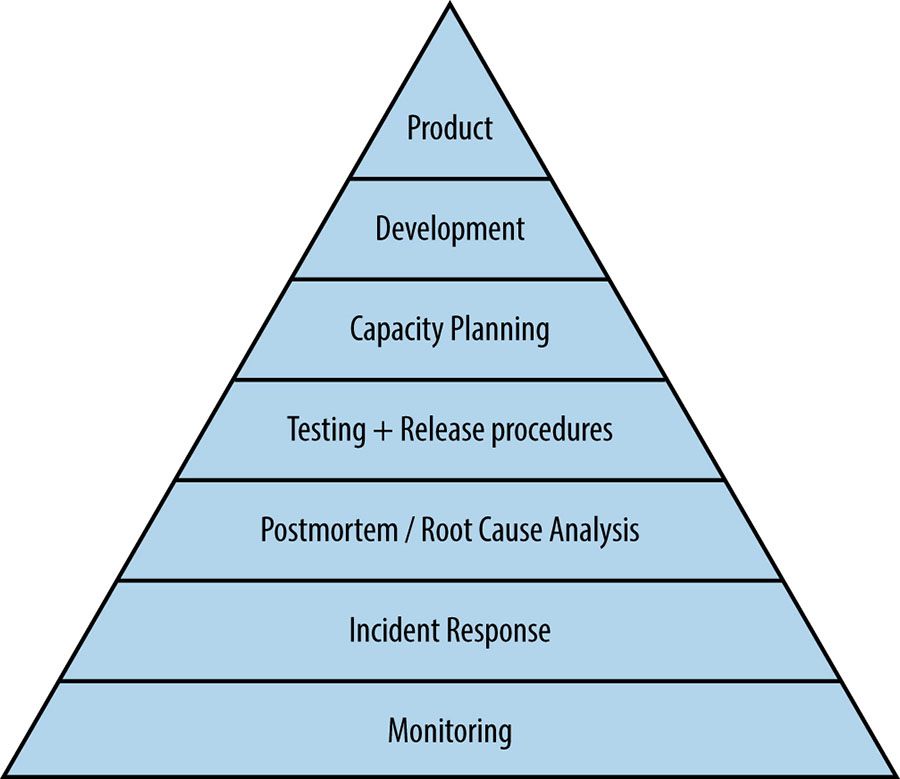
Production Excellence
And idea I first heard about in a talk by LizTheGrey. Here are some slides I found at some point:
Sections
- Architecture
- Comics
- DevOps
- On Call
- Incident Response
- Logging
- Observability
- Production Readiness
- Security
- SRE
Incident Response
- Communication during incident response is super important. Internally, the customer support team needs to know something is up because customers may be calling in to ask why our software isn’t working. Externally, customers directly impacted by an outage may want to keep up to date on the status of the outage and when a fix is likely to land. Somebody responsible for communicating the status of an incident while it’s being worked should be appointed right away when the response team forms.
- Heroku status page for an event includes incident updates and post incident response report:
This looks pretty great. I like the follow-up report template too. Looks like …
- Summary
- Who was affected?
- What happened?
- What we’re doing to make sure it doesn’t happen again?
- Heroku status page for an event includes incident updates and post incident response report:
This looks pretty great. I like the follow-up report template too. Looks like …
- On call: Slide deck from Charity majors about running a healthy oncall practice. (2022) Ownership / shared responsibility factored largely as well as prioritizing resilience work and observability.
Checklist: Production Readiness
Stuff I think about when I’m getting a new application ready to run in prod. They have all caused me pain in one way or another at some point … 🙂
- How critical is it to the business? (Should an engineer be woken up in the middle of the night if it goes down?)
- Monitoring
- Metrics for a webapp: traffic volume, latency, and errors
- What are the pageable aspects of this service? Remember these choices will potentially cause a human to be woken up in the middle of the night. There shouldn’t be many of them and they should all be urgent and actionable. Most things are probably important-not urgent, handle next business day. (At least with the right amount of consideration towards failover, resilience, fault isolation, etc.)
- Logs are being shipped to a central place where we can setup filters and alerts on them
- Are logs being rotated? Should they be?
- Exceptions are being captured and reviewed by somebody
- Is there a /healthCheck url we can use to determine readiness?
- This check should test the service itself, and dependencies in a meaningful way to let us know it is ready to do work
- It should be fast and return 200 if ok, 500 otherwise
- This is the url we’ll setup a load balancer to ping
- Is there data to be backed up? (If we are taking backups we should be verifying we can restore them)
- Do we have environments including develop, staging, and production and a process to promote changes through them
- How do we deploy new versions of this?
- Is it well documented?
- Service pages are nice (Who owns the service, an architecture diagram, links to runbooks, links to dashboards)
- Show me the tests! (Unit, end to end and other. Should be automated and able to run all the time)
- Have we gone through a threat modelling exercise with it? (Talk about principals, goals, adversities, invariants)
DevOps
- Culture that accepts that failure happens and is usually an opportunity for growth
- From Practice of Cloud System Administration
- Workflow: is about our process of delivering value to production from start to finish (From idea / problem identified to deployment to production) and the steps along the way. Understanding how changes are made at the lowest level lets us examine how we work and look for opportunities where we can do better
- Repeatable
- Don’t pass defects to next step
- Don’t let local optimizations degrade performance globally
- Increase the flow of work after tasks are repeatable by speeding them up (automate), or eliminating them
- Feedback: visibility into change as it happens
- Continuous learning: means creating a culture where it’s ok to try new things, and learn from the experience. Failure is not stigmatized (In fact there is much to be learned when things don’t work the way you expect. Your mental model of the world may need a small nudge.)
- Workflow: is about our process of delivering value to production from start to finish (From idea / problem identified to deployment to production) and the steps along the way. Understanding how changes are made at the lowest level lets us examine how we work and look for opportunities where we can do better
Levels
- Level 1: CALMS
- Culture of
- Automation
- Learning (I’ve heard lean here too but that seems less interesting to me)
- Measurement
- Sharing
- Culture of
- Level 2: You write it, you run it!
Shared Ownership of Production
- Shared reliability collab model @ booking.com: A very neat walk through of a model of managing production that involves dev teams and ops.
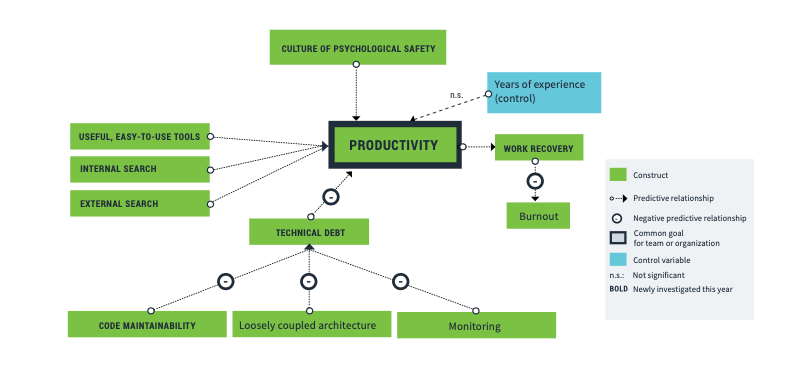
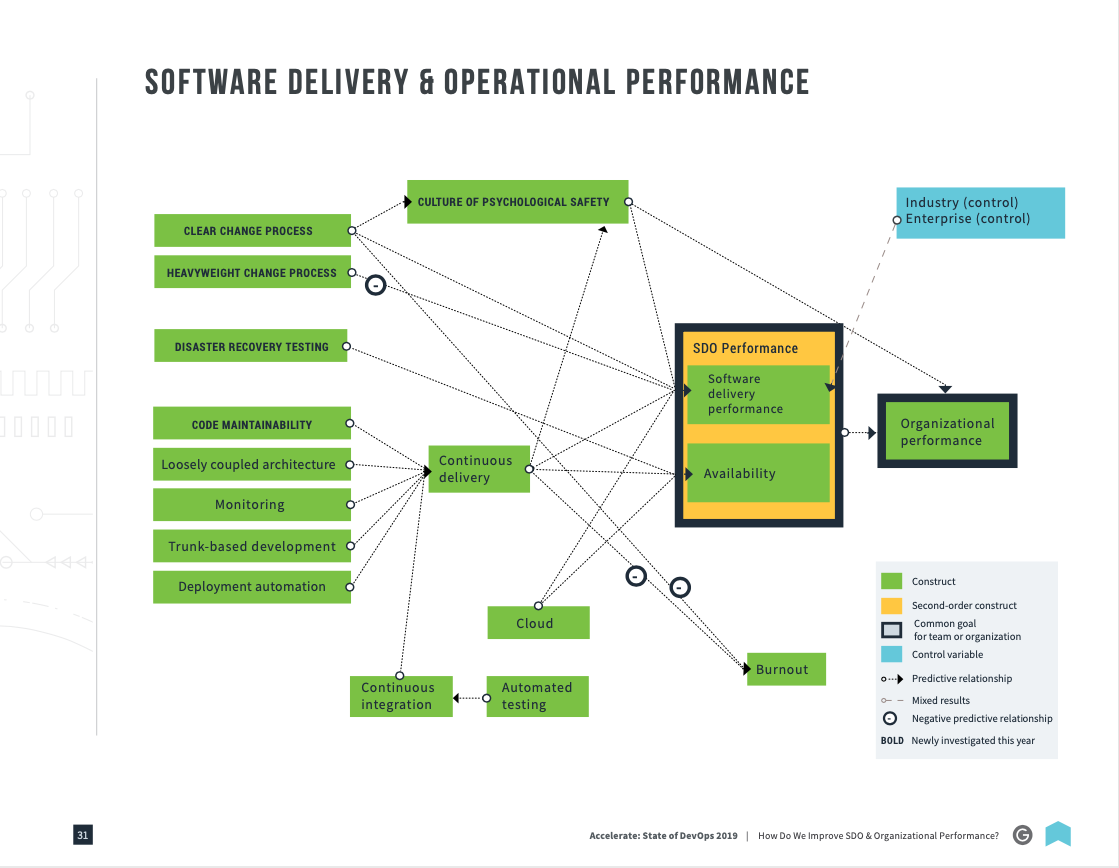
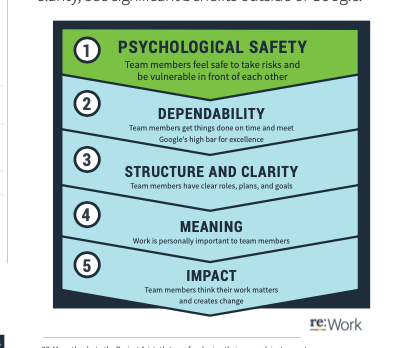
DORA Reports
PagerDuty SRE Team Goals
- Ensure our work connects to organizational goals.
- Partner with Engineering stakeholders to define a supportable and performant service architecture (paved road).
- Continuously strive to improve the customer experience: Full lifecycle support (creation, development, deployment, retirement), observability, flexible connectivity, and monitoring.
- Favor managed, commercially supported, or industry-accepted solutions over systems built in-house.
- Proactively notify the organization of any significant infrastructure changes.
- Measure success through adoption.
- Revisit design choices and components that are rendered obsolete and see what can be replaced with managed or off-the-shelf parts, or substantially simplified.
- Share SRE expertise in service to the entire PagerDuty organization.
- Factor operational costs in architectural and platform decision-making.
DevOps tries to …
- Reduce organizational silos
- Encourage acceptance of failures as normal. (continuous learning, there will always be things going wrong)
- Implement gradual change (eg canaries)
- Leverage tooling, and automation (eg automate away last year’s job)
- Measure everything
Source: Liz, Seth Vargo video series about devops
Links
Logging
Levels
- DEBUG –Any information related to things that are going on in the program. These are often messages written by programmers for debugging purposes.
- INFO –Any user-initiated action or any system operations such as scheduled tasks executing, or system startup and shutdown.
- WARN –Any condition that could become an error state in the future. Library deprecation warnings, low available resources, or slow performance are examples of entries that would go in this level.
- ERROR –Any and every error condition should go in this level.
- FATAL –Any error condition that causes the system to shut down. For example, if the system needs 32 GB of memory on startup and 16 GB is all that’s available, the program should log a FATAL error message and immediately exit.
Links
Comics
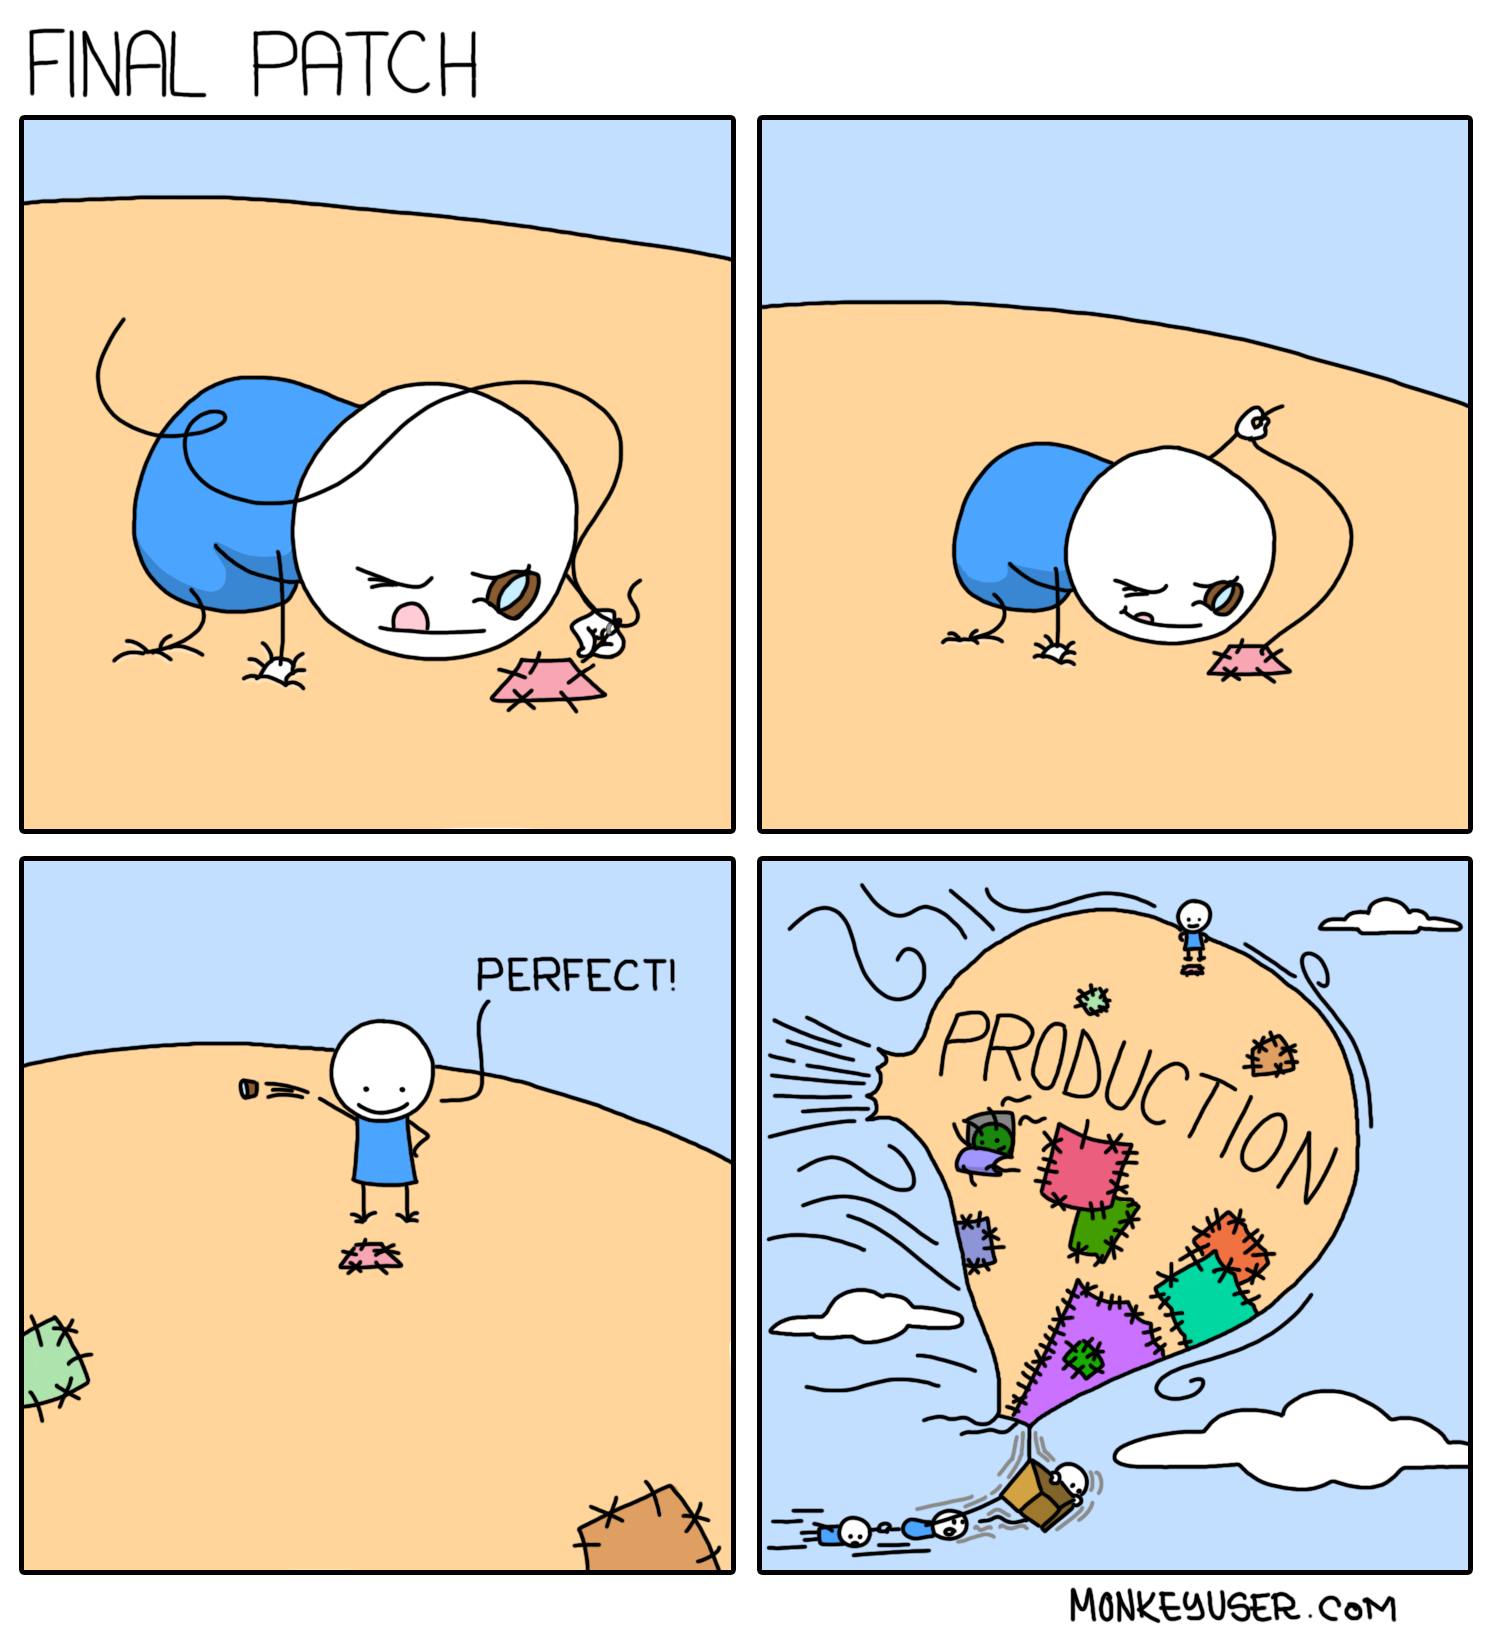
SLIs, SLOs, SLAs, Error Budgets … Oh My!
Want to be able to answer the question “When should we slow down a bit to work on making our application more reliable, or performant?”
This is a framework to define availability in concrete terms, determine acceptable levels of it, and then come to a consensus with product, development, and the business about what we do when we don’t have enough of it.
- SLI – Service level indicator. A system metric that can be used to classify a request as either good or bad. eg 95th should be < 100ms for requests to our web application
- SLO – Service level objective. A measure of how well we’re doing over time with respect to an agreement we make internally with ourselves of what good / bad even means. eg In the previous 30d, 99% of the time we should hit our stated latency goals. Note: A corollary is we don’t want to exceed our goals either. It’s time + energy taken away from work that could be put into making a better product
- SLA – Service level agreement. A promise we’re comfortable making to customers about how much availability we’re willing to guarantee. There may even be financial penalties associated with failure to meet goals
Links
- SRE implements DevOps:
A series of videos with Liz Fong-Jones and Seth Vargo that talks about what devops is and how SRE relates to it. (SRE is how Google decided to adopt some of the principles of the devops movement)
- Reduce toil
- De-stigmatize failure
- Error budgets, slos, slis
- Better communication between developer and production support teams
- Measure all the things that matter
- Tiny batches, gradual change
- How github deploys code
Platforms
All platforms must have a story around these functional areas. Even if you don’t think of your system as a platform ( maybe you didn’t intentional design it as such) you have one!
- Service discovery
- Release management / deployment
- Internal / external routing
- Config / secrets management
- Run code
From the System Design Primer
Start with use cases and constraints
- Who is going to use it?
- How are they going to use it?
- How many users are there?
- What does the system do?
- What are the inputs and outputs of the system?
- How much data do we expect to handle?
- How many requests per second do we expect?
- What is the expected read to write ratio?

Observability
I’ll fill in this section more as I go but for now I’m going to start collecting links I thought are really helpful to my overall understanding of the movement here:
Observability @ Tucows
- Unpacking observability: Begins by describing what issue investigation could be like with thoughtful, pervasive instrumentation. Wide events with a focus on spans and traces. “Know what normal looks like in prod”. OpenTelemetry lets you collect this stuff and send to a backend of my choosing. (Honeycomb and datadog are 2 examples of services that are otel compatible)
- Definitions! Logs, events, traces and spans: Excellent. Logs are what we’re pumping out pretty much exclusively at work these days. Unstructured and without much context (inconsistent context?) in terms of the broader event a particular message belongs to. Events add structure, spans are containers for strongly related events and traces hold related spans
The Observability Journey (A twitter thread by Charity majors)
- On call
- Dedicated sustainability work (10-15% of developer capacity)
- Monitoring, tracing
- SLIs, SLOs : Put in place a few key ones to get started with so when you talk to leadership about investments to be made in resilience and availability you have real data to back up the recommendations you’re making in terms of platform / product investments
- Product
I've been talking to lots of teams about their observability journey, or how they managed to dig themselves out of hell and get a handle on shit. Some patterns definitely emerge.
— Charity Majors (@mipsytipsy) September 27, 2021
Links
- Mapping Out Your Observability Journey: Breaking down big plans into digestable chunks is key to getting buyin and shipping. It’s really hard to get everything you want done in the first go for bigger projects and just attempting this can mean you never ship!
- Start with the signals you have - eg log file analysis - to get what’s happening right now by high cardinality dimensions (eg userId, ip, api endpoint etc)
- Then proceed to the why by instrumenting code. Even linking in a lib like opentelemetry will automatically start watching stuff like http requests (Minimum energy, get to spans)
- Start with a single service. Add dependencies in a subsequent step to break up the work and start showing people what’s possible
- Look for wins in investigations to show the business it’s worth it. This road is long and not cheap!
- Instrument more
- Learn how to write queries against your data depending on whatever backend you choose
- Start cheap. Most backends have free tiers that are good for small services. Some things can be self hosts. (eg Prometheus and Jaegar)
- Get more people excited about your new super powers
- Deployment strategies for OpenTelemetry: An article on the lightstep blog but a core committer to the otel project. Seems like the first step is to install the otel collector everywhere. This lets you lift and shift instrumented data to any backend metrics / traces host that supports the otel protocol. (Which is many of the big ones : prometheus, datadog, sumologic, lightstep, etc.) Step 2 is instrumenting apps which is slower / harder for sure. He recommends starting with the most important work flow through an app end to end so people can see the value and start to get excited
- Observability vs BI Tools and Data Warehouses:
The requirements are different between these 2 ways of looking at system data:
- Accuracy: You’re often sampling with observability tools because the data you’re searching is huge. You’d be happy looking at 99% of the data (or less) if your queries are fast
- Recency: I’m looking into a production issue right now when I open up a monitoring tool. (BI systems look back much further)
- Execution time: BI queries can takes many seconds to minutes to get an answer. Monitoring systems usually give you back something pretty quickly
- Structure: Data warehousing usually implies structure in your dataset. The questions you’re asking about the data are well known. (How many shoes did I sell in Ontario in January 2022?) Given the queries you want to run and there isn’t a lot of adhoc querying you’re better off structuring your data more than you would in an observability tool that wants to ingest arbitrarily wide events without necessarily a lot of structure
- Unpacking Observability: The Paradigm Shift from APM to Observability:
- Logs as we have used them don’t always make it easy to slice and dice monitoring data by user
- My thought: Logs are fine for many systems. Monolithic ones more so. Can capture attributes of a request in a way that is searchable. eg userId=1, …
- Traces can be better if we’re collecting the right data as we generate them
- Traces can capture context in a way that we can reasonably search and retrieve info (eg key=val)
- Traces show you where a request spends time during processing
- Not all monitoring backends are created equal
- High cardinality data handling
- How well can you dig into your data during analysis
- Logs as we have used them don’t always make it easy to slice and dice monitoring data by user
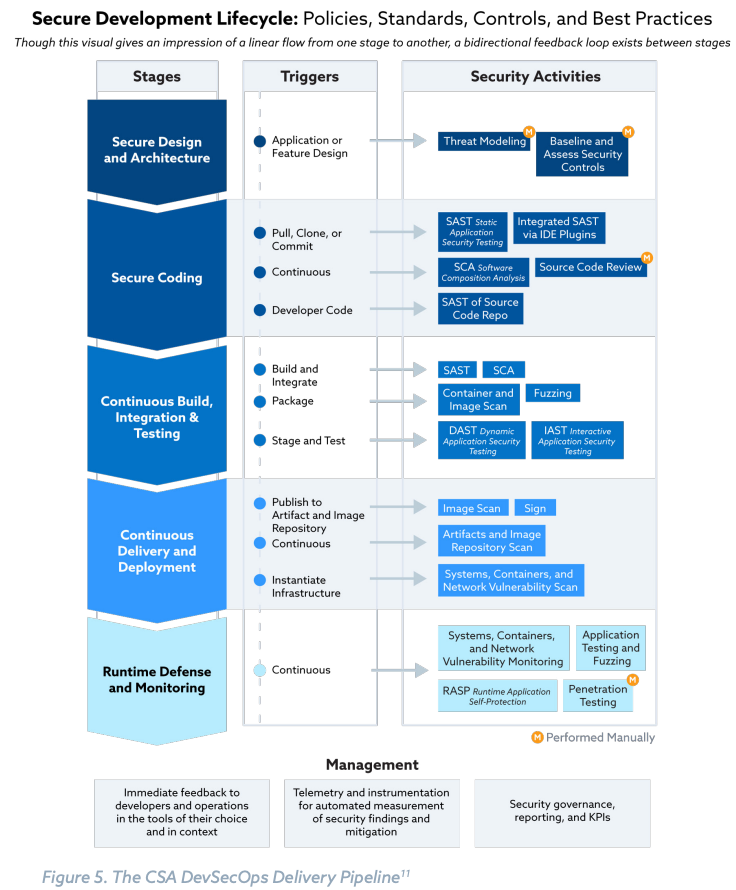
Security
- An introduction to approachable threat modeling: A personal favourite of mine. Presented in this article is a way to think about threat modelling of a system that is straightforward and doesn’t add a lot of overhead that is avoided.
- Principles, (who is interested in this system being up)
- Goals, (What do we want the system to be able to do, within what constraints)
- Adversities, (What could happen that would interfere with our goals)
- Invariants (What should also be true in the system to ensure applied workloads make progress)
- Getting started with AWS
- The root account
- Create an IAM user
- Lock this down after you’ve the initial user - setup mfa on a separate device used specifically for this account and put it in a safe place. (Probably make sure at least a couple of people are able to login to the root account) It’s the only account you won’t be able to restrict
- Check contact and alternate contact details. You want to be able to retrieve the root account somehow with AWS’s help if you can’t access with username / password somehow or the MFA device isn’t working.
- Organizations, multiple accounts
- Create at least 2 accounts to get started with: Pre-prod, Prod
- SSO
- Use AWS’s SSO product (or central identity provider). This let’s you centralize users, groups for all accounts and require strong passwords and mfa devices centrally.
- IAM
- Don’t give service accounts or users more access than they need to do their work (Least privilege)
- Avoid long lived access keys
- Audit accounts and privileges regularly (at least yearly)
- Use roles and groups. Don’t attach custom policies directly to users
- Think about roles you need. eg BillingAdmin, Security, Operations, Developer,
Dev etc - As well as what these different roles should have access too
- Environments
- Workloads
- The root account
SRE
- How Honeycomb defines SRE work:
- Fred Hebert defines 3 aspects
- Reliability roadmap: His team largely helps by providing feedback from production, figuring out practices that lead to better operational outcomes, champion continuous improvement around uptime and reliability
- Incident response: Help think about how the team responds to incidents. Learn and evolve by identifying good practice. Make sure work and the system are managed sustainably
- I have to think about the other aspect of this … influence work upstream and downstream of incidents
- Tools, assistance, feedback from production: develop software to improve reliability of the system. Eliminate toil + improve / support daily work of team! Help back operational excellence into the design of the things we build
- These aspects are balanced somewhat but the energy allocation can change from month to month:
- Period: Reliability, Incident response, tools + assistance eg splits
- Feb-March: 45%, 50%, 5%
- April-May: 35%, 20%, 45%
- June-July: 20%, 15%, 65%
- …
- Period: Reliability, Incident response, tools + assistance eg splits
- Fred Hebert defines 3 aspects
On Call
Series of articles @ Honeycomb by Fred Hebert
- OnCallogy Sessions: How HC increases awareness of the system and how it works through the team. Ongoing teaching sessions (did he say weekly?) where they talk about some aspect of the system or their practice. Very neat idea.
- Tracking On-Call Health: Tracking the health of an oncall process is hard. You can’t just say we haven’t had an incident in 3 months so we must be doing great. The bad thing about oncall is about getting the call overnight, it’s having to carry the pager and the implication that you can’t do what you want. It’s impossible to eliminate all fall alarms or pages. You can reduce anxiety and stress though. Things that should be measured somehow:
- Response, Monitoring, Learning, Anticipation
- Further reading: RAG – Resilience Analysis Grid


