


Monitoring: Application logging, structured logs, wide events
Logging @ Stripe
- Fast and flexible observability with canonical log lines: One of the earliest treatments of canonical log lines I can find. Wide log events are generated in addition to the chattier kind. The wide events have a marker token that’s used to filter them in their log analytics tool during production debugging.
A canonical log line looks like
timestamp canonical-log-line controller=c action=a time_ms=100 …
- Additionally they use s3 + redshift for long term storage and search
Links
- All you need is Wide Events, not “Metrics, Logs and Traces”: Another ex-user of scuba from Facebook. 1 log line per request per service, with many key=value dimensions that are searchable, can be aggregated, etc
- A Practitioner’s Guide to Wide Events: Detailed article about how to do structured logging in a way that will make it easier to find insights later. Lots of standard properties are suggested that have been helpful in the author’s experience. Looks like a really great resource for these ideas!
To observability lasanga from dashboard soup
- How the should platform
- Here we get together and talk about invariants in terms of system behaviour
- Prove it does that by applying load
- Ask questions about how the system is working
- Measure that it is doing what you think it should
- Dashboards are important but many are 1*off ones built after an incident
- They should be thought of as something that provides a feeling to help debug an issue in production
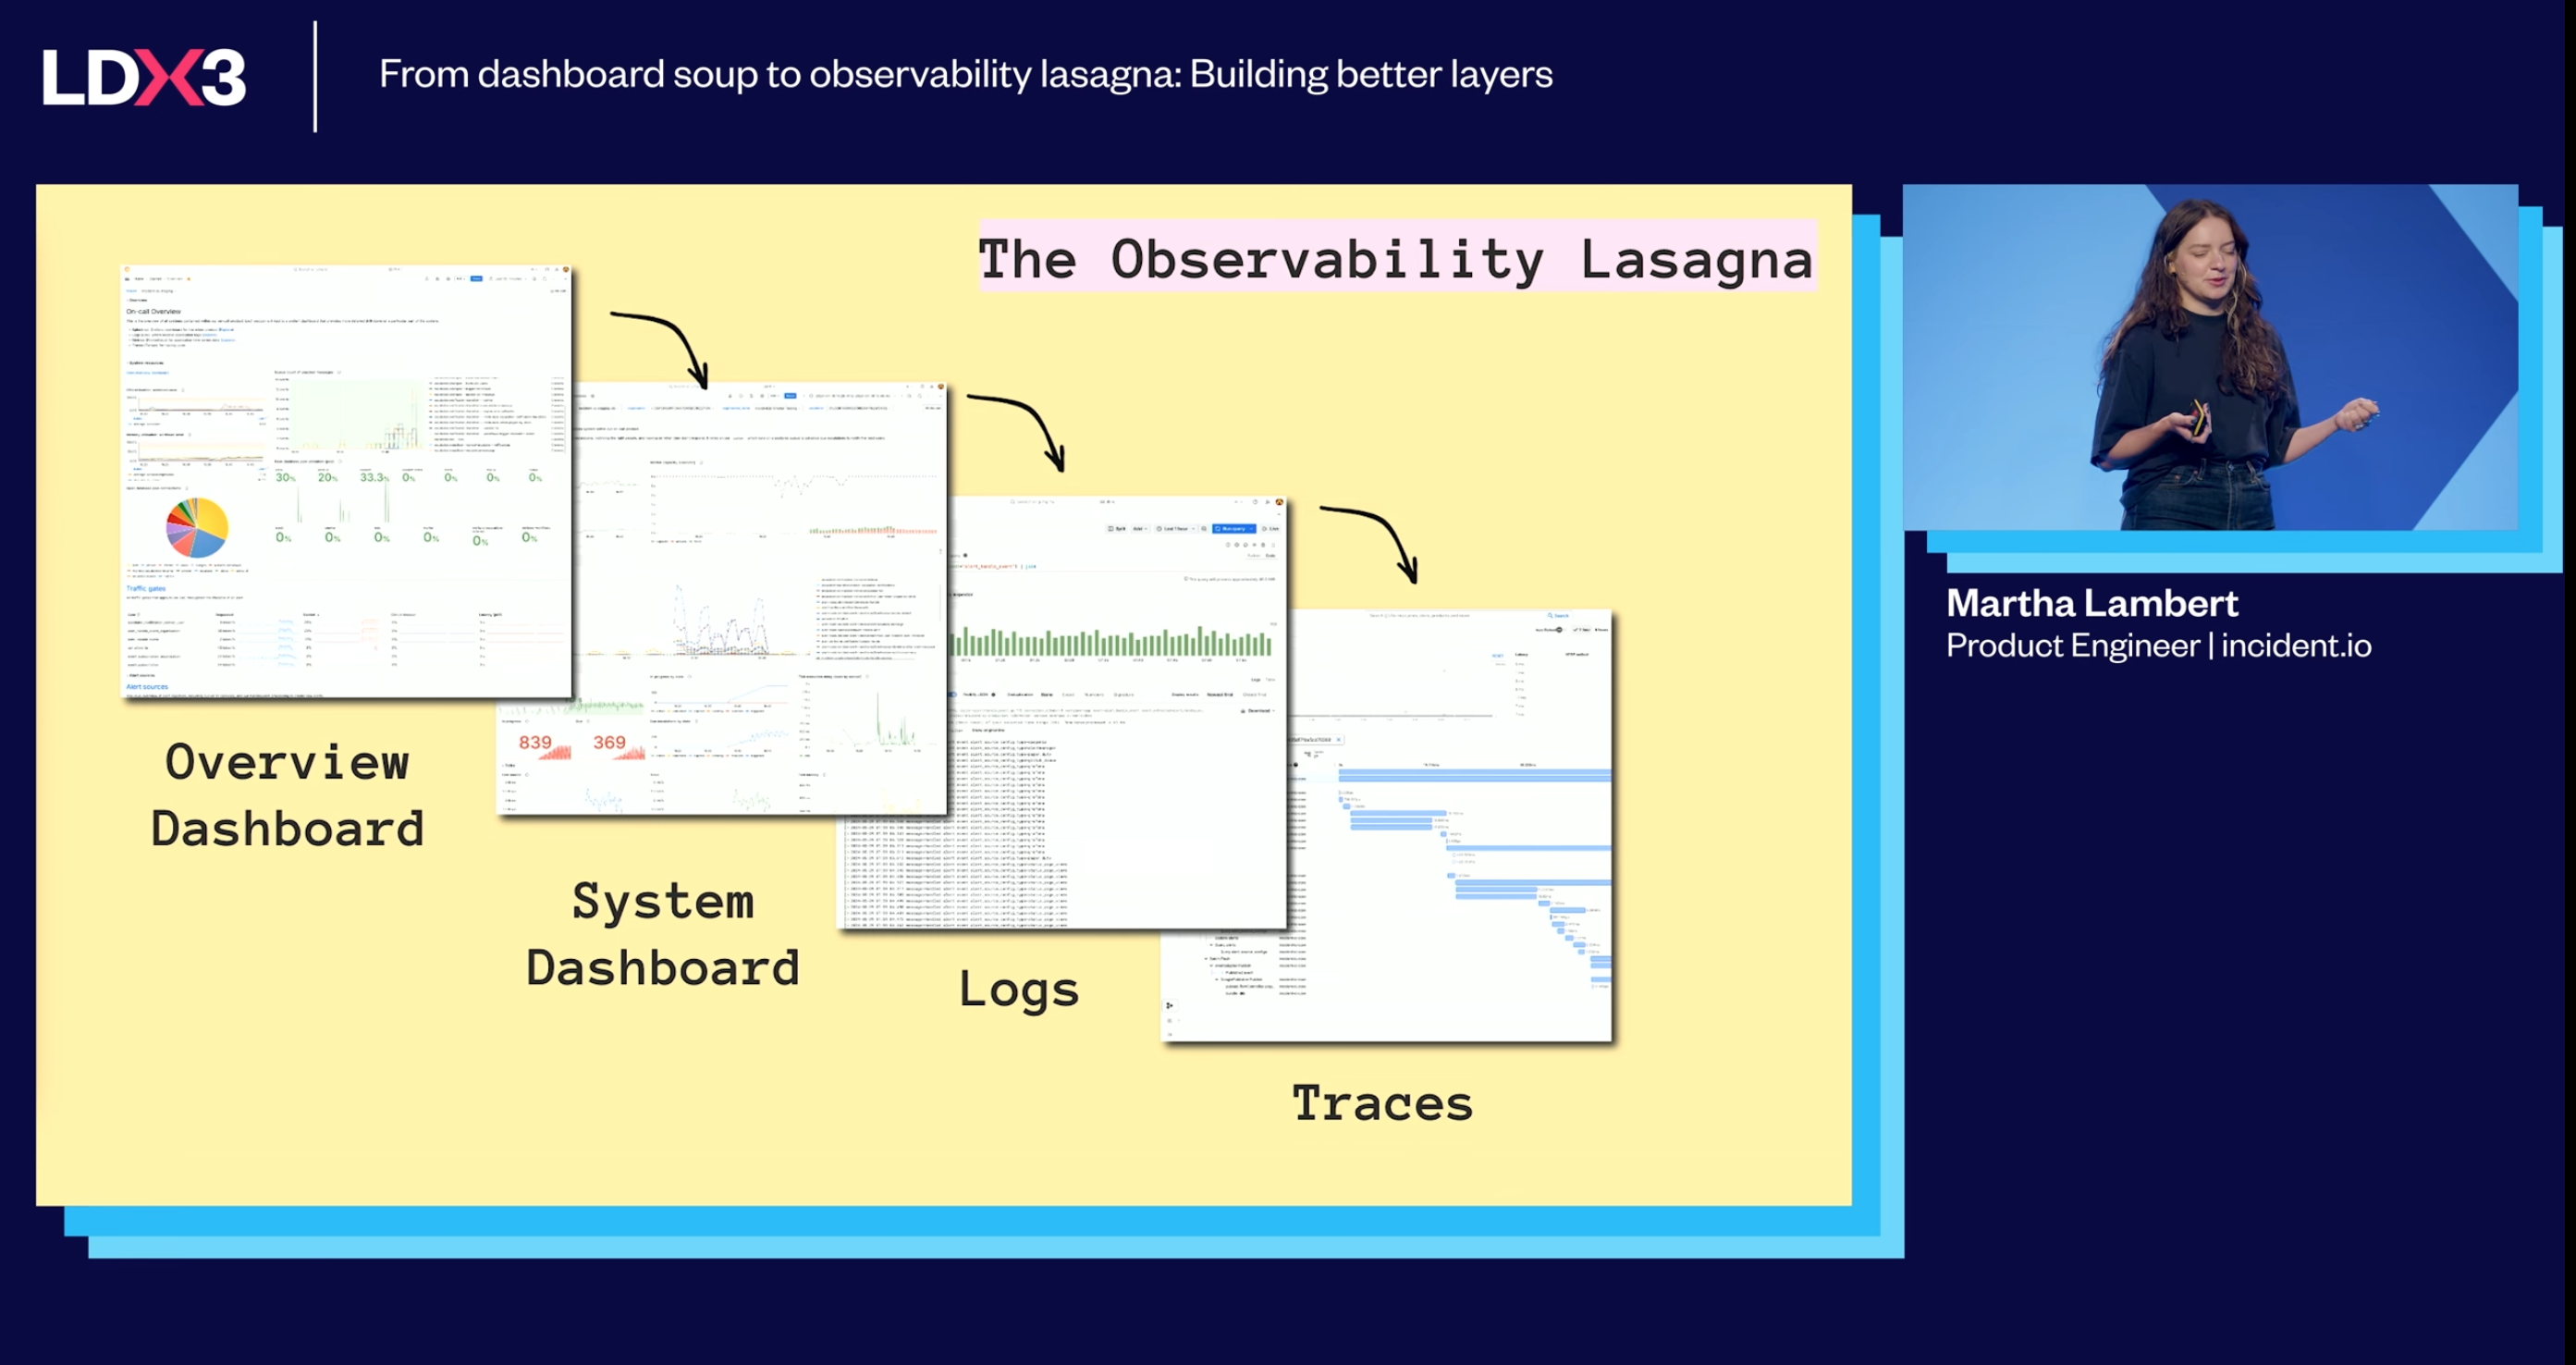
Overview dashboard has high level metrics of infra, services, alerts, alert routing, etc. They’re a bunch of jumping off points to more detailed dashboards.
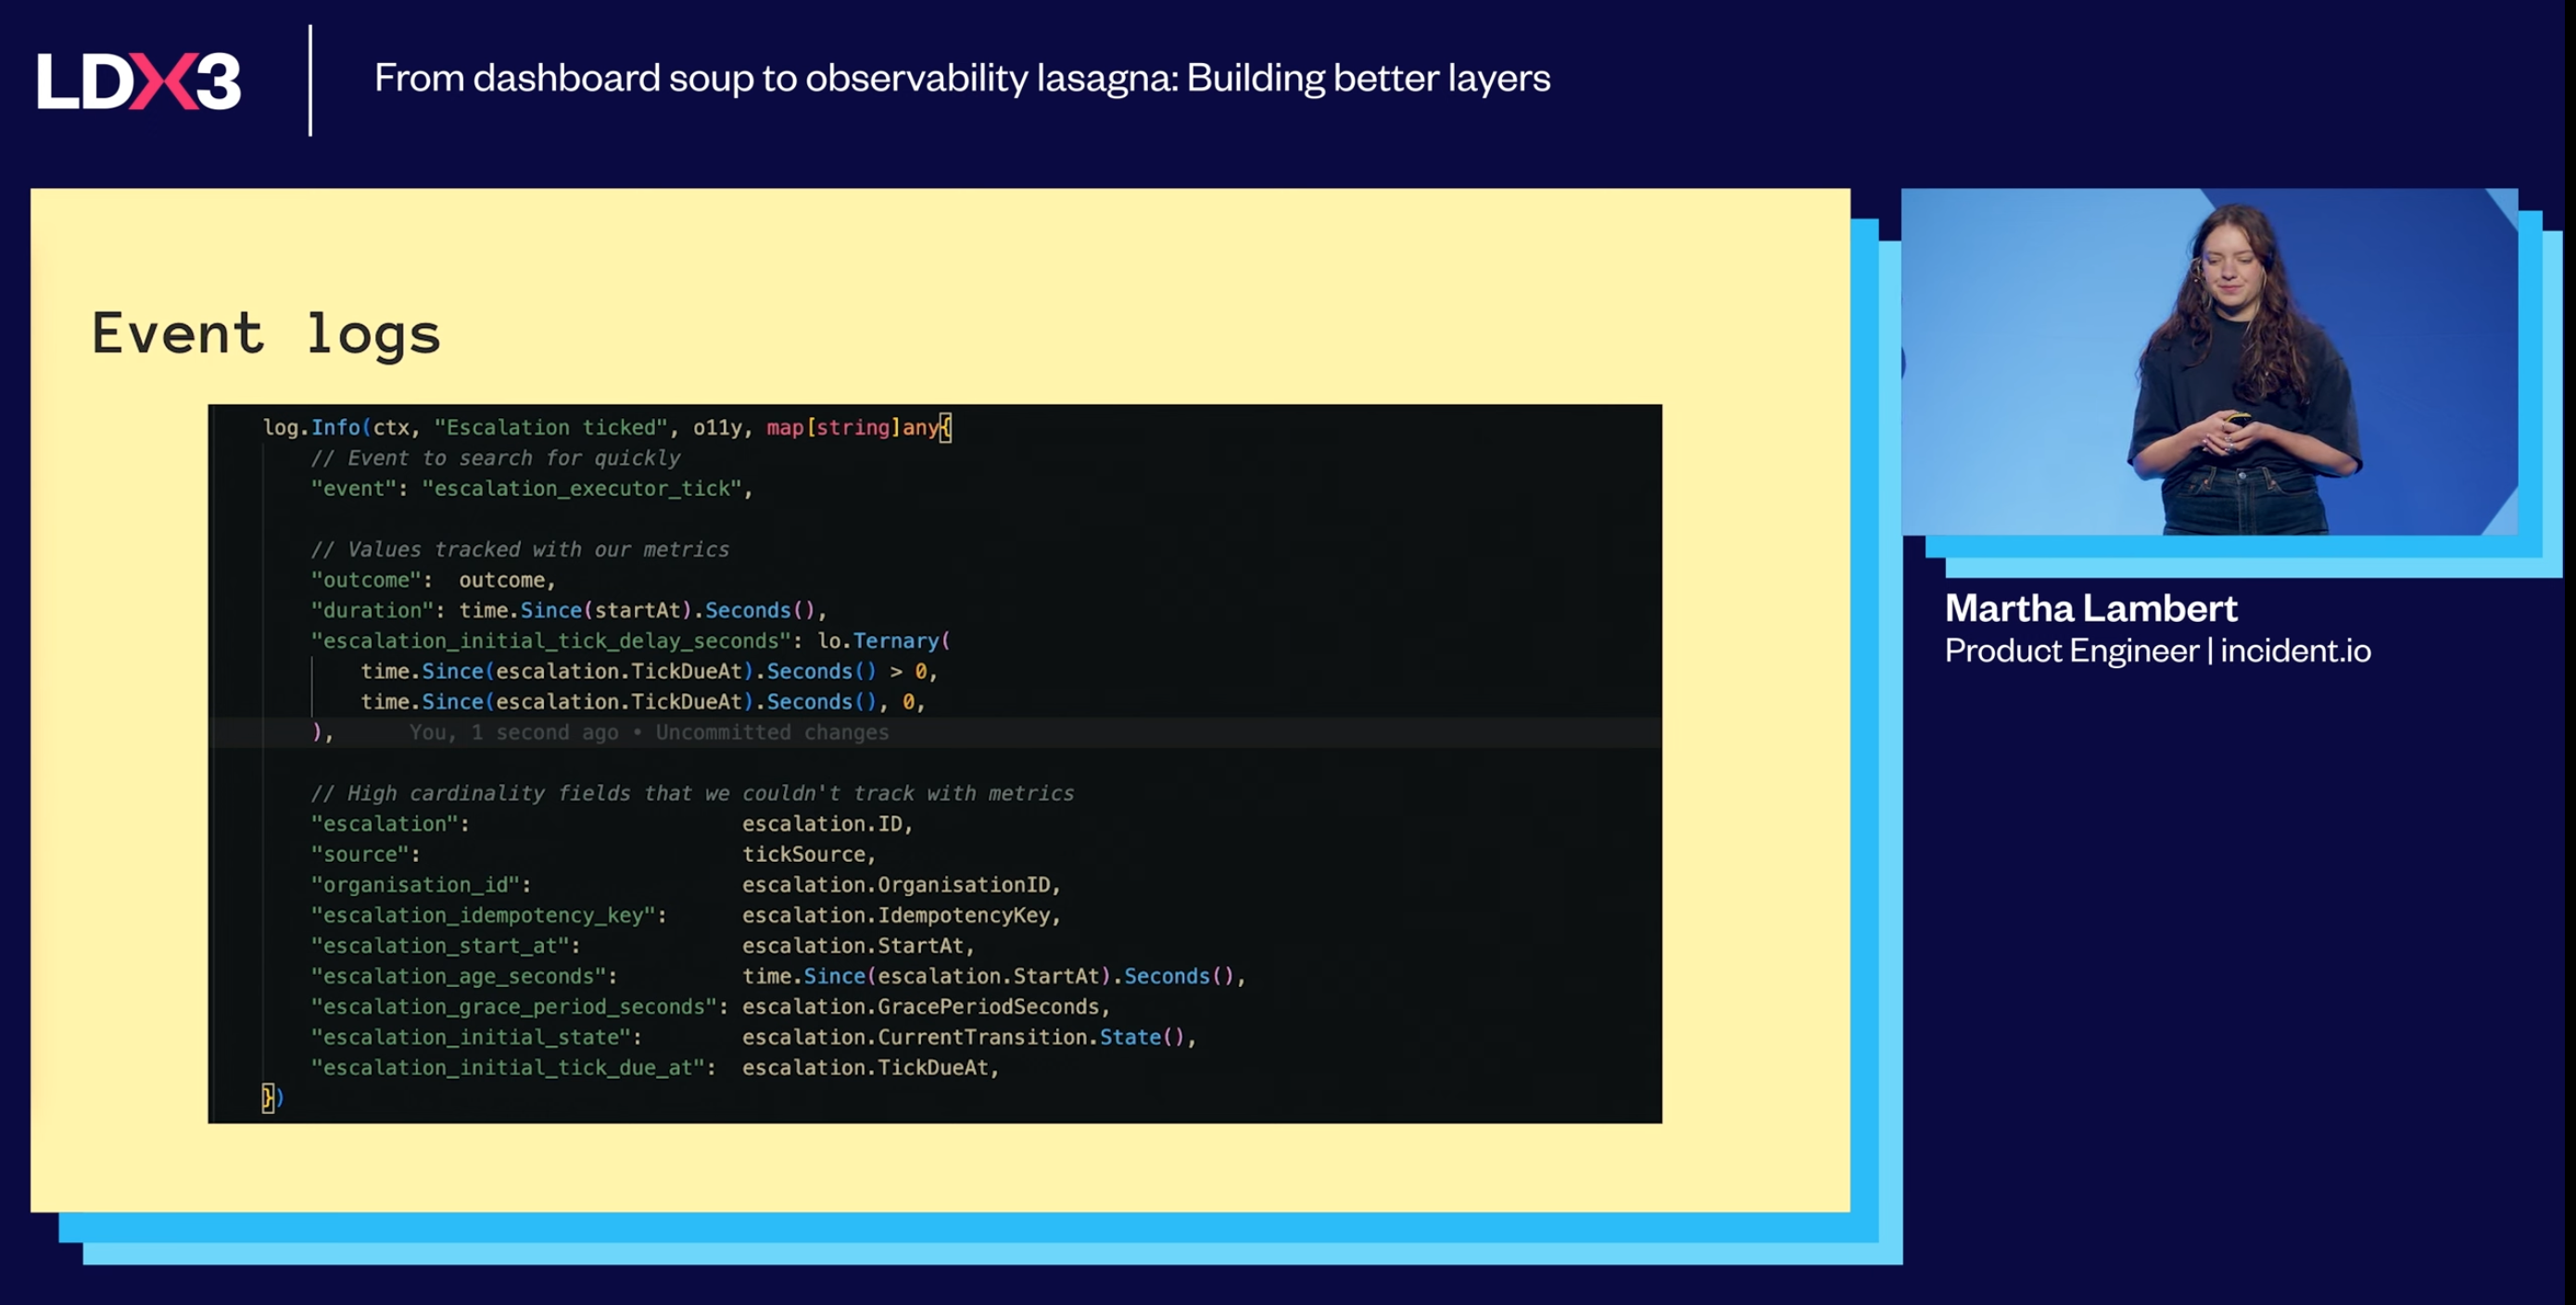
An example of a structured event.
Tips
- Key metric observed user response time for a request
- Connect metrics and logs through structured events
- Always log event during panics / crashes
- Visualize service limits
- Do game days that use the observability tooling to look into an issue (they do quarterly)