


Weekly notes
- Top Chef Stats: I like the design that went into this website. Good example of html structure and styling.
- Optimizing a power display with Claude Code: Claude llm helps find slow frontend code in a solar power system reporting ui. It doesn’t do as well finding a backend issue in this case …
- Code research projects with async coding agents like Claude Code and Codex: Research projects using an empty git repository you hand over to an asynchronous agent and then let it work on its own can bear fruit …
- Linux Load Averages: Solving the Mystery: I keep coming back to this one to remind myself about what load averages represent on linux
To observability lasanga from dashboard soup
- How the should platform
- Here we get together and talk about invariants in terms of system behaviour
- Prove it does that by applying load
- Ask questions about how the system is working
- Measure that it is doing what you think it should
- Dashboards are important but many are 1*off ones built after an incident
- They should be thought of as something that provides a feeling to help debug an issue in production
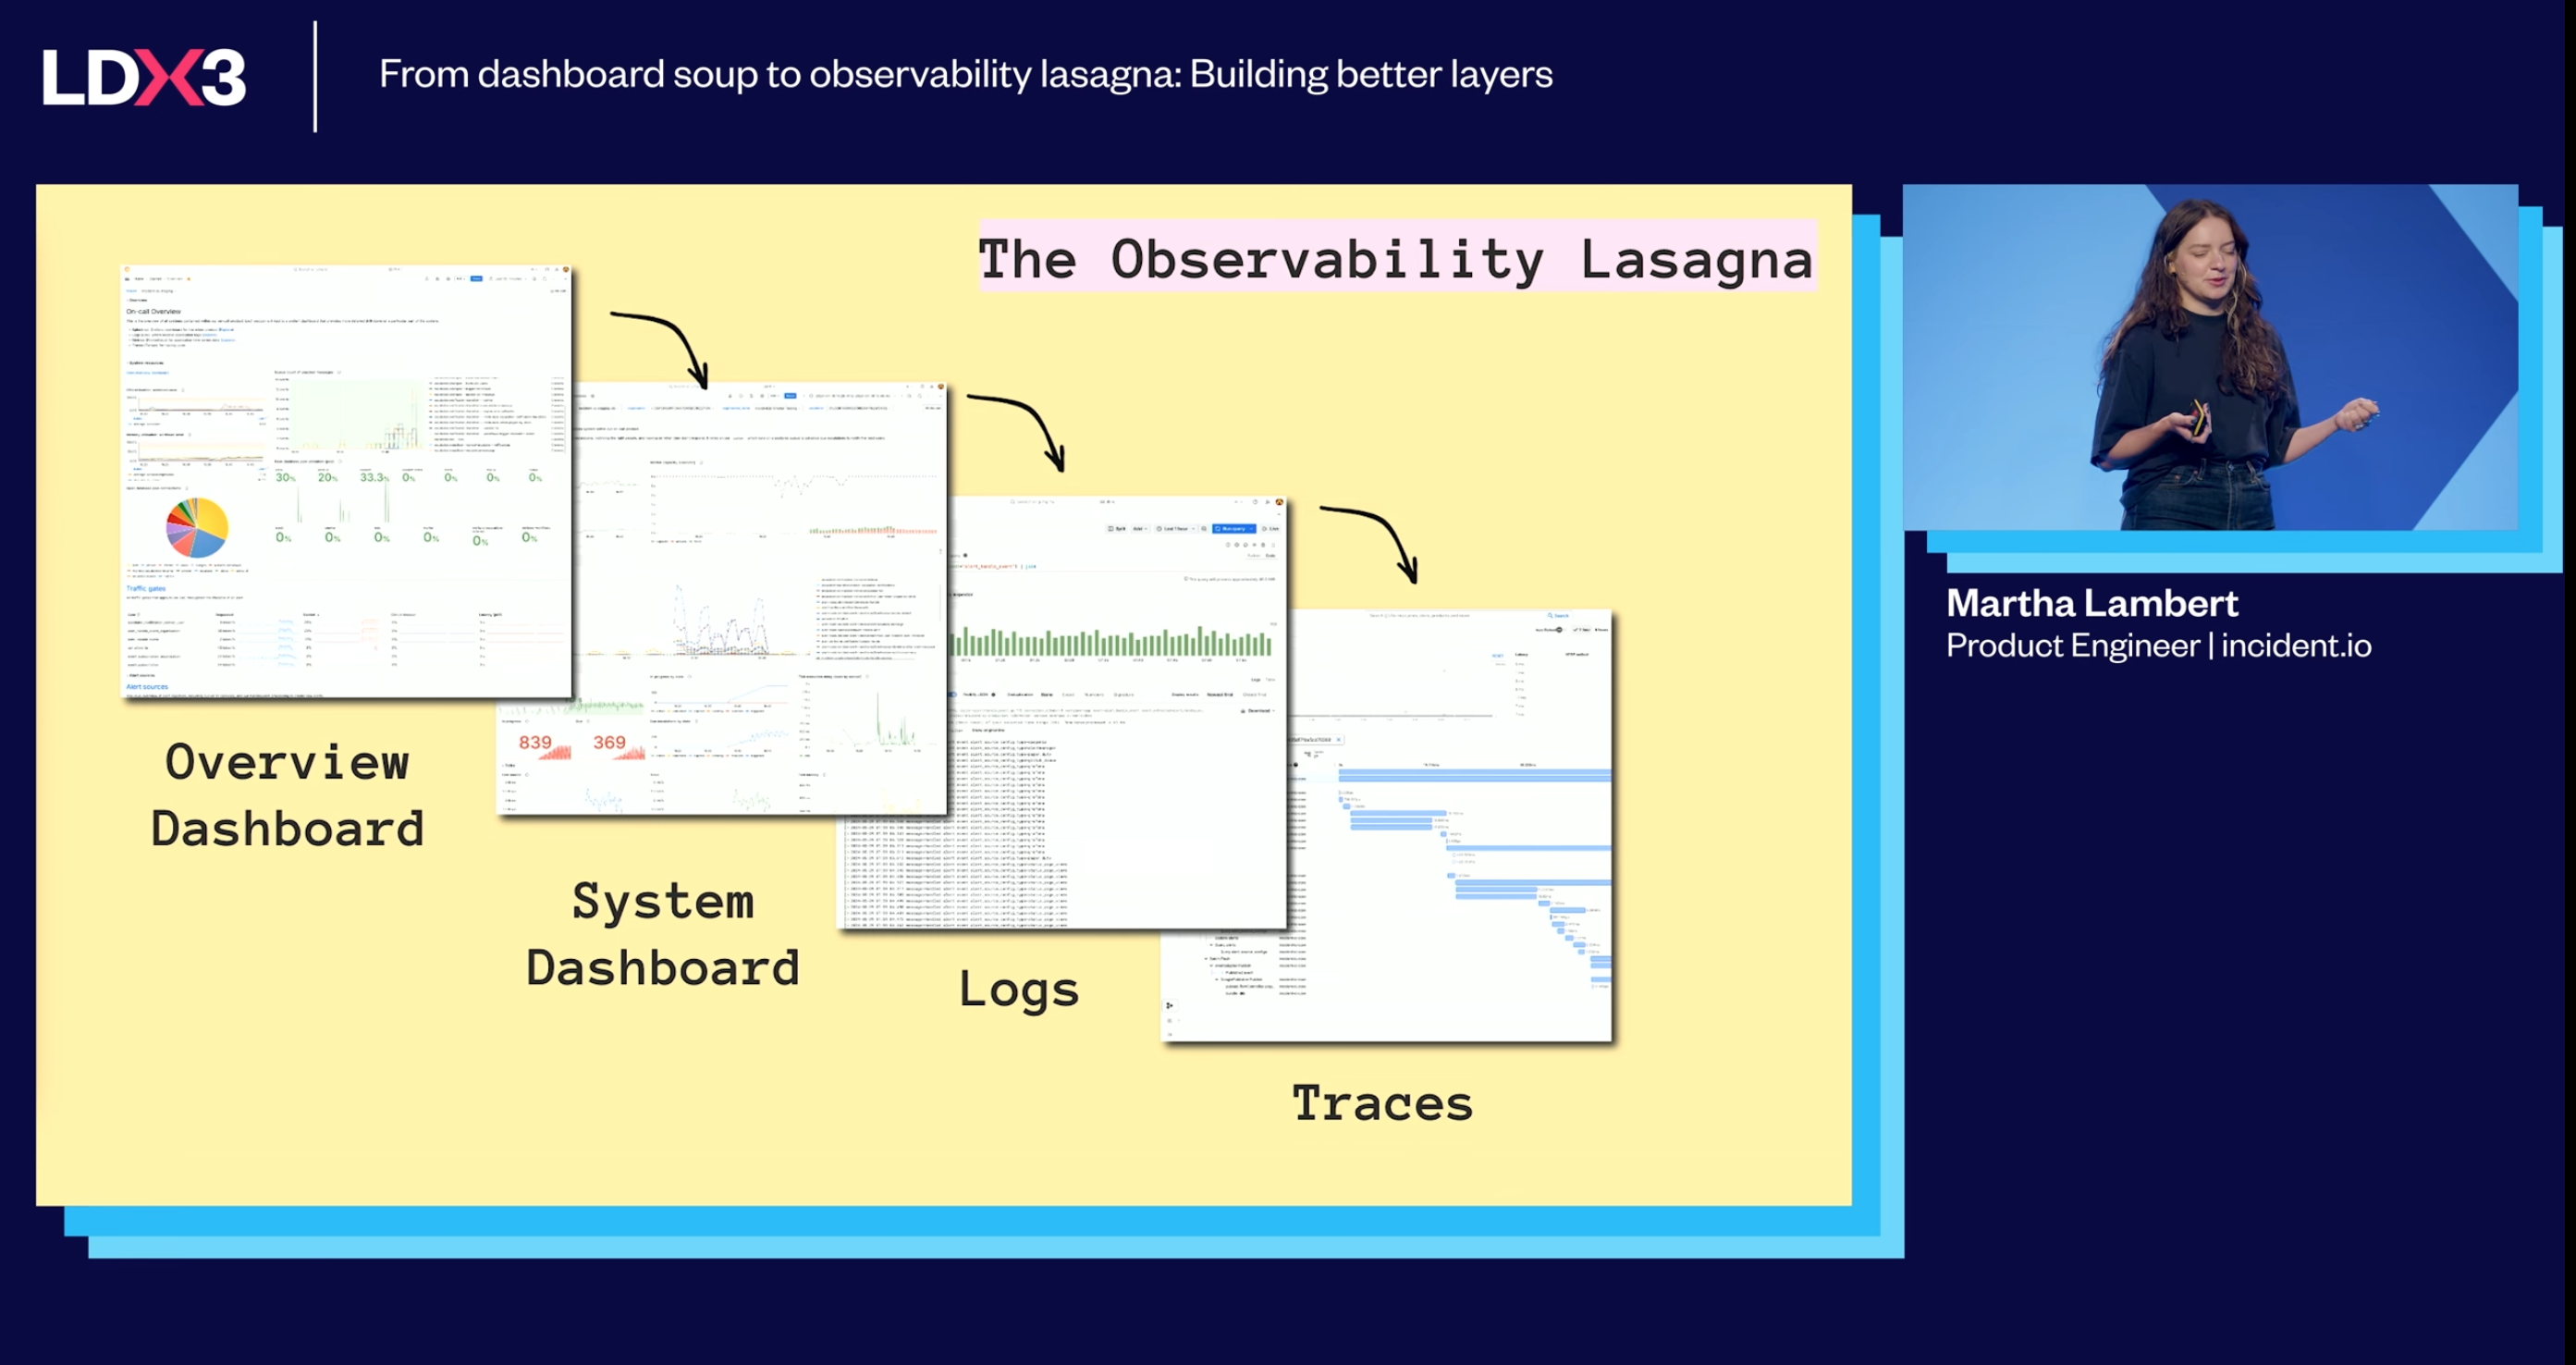
Overview dashboard has high level metrics of infra, services, alerts, alert routing, etc. They’re a bunch of jumping off points to more detailed dashboards.
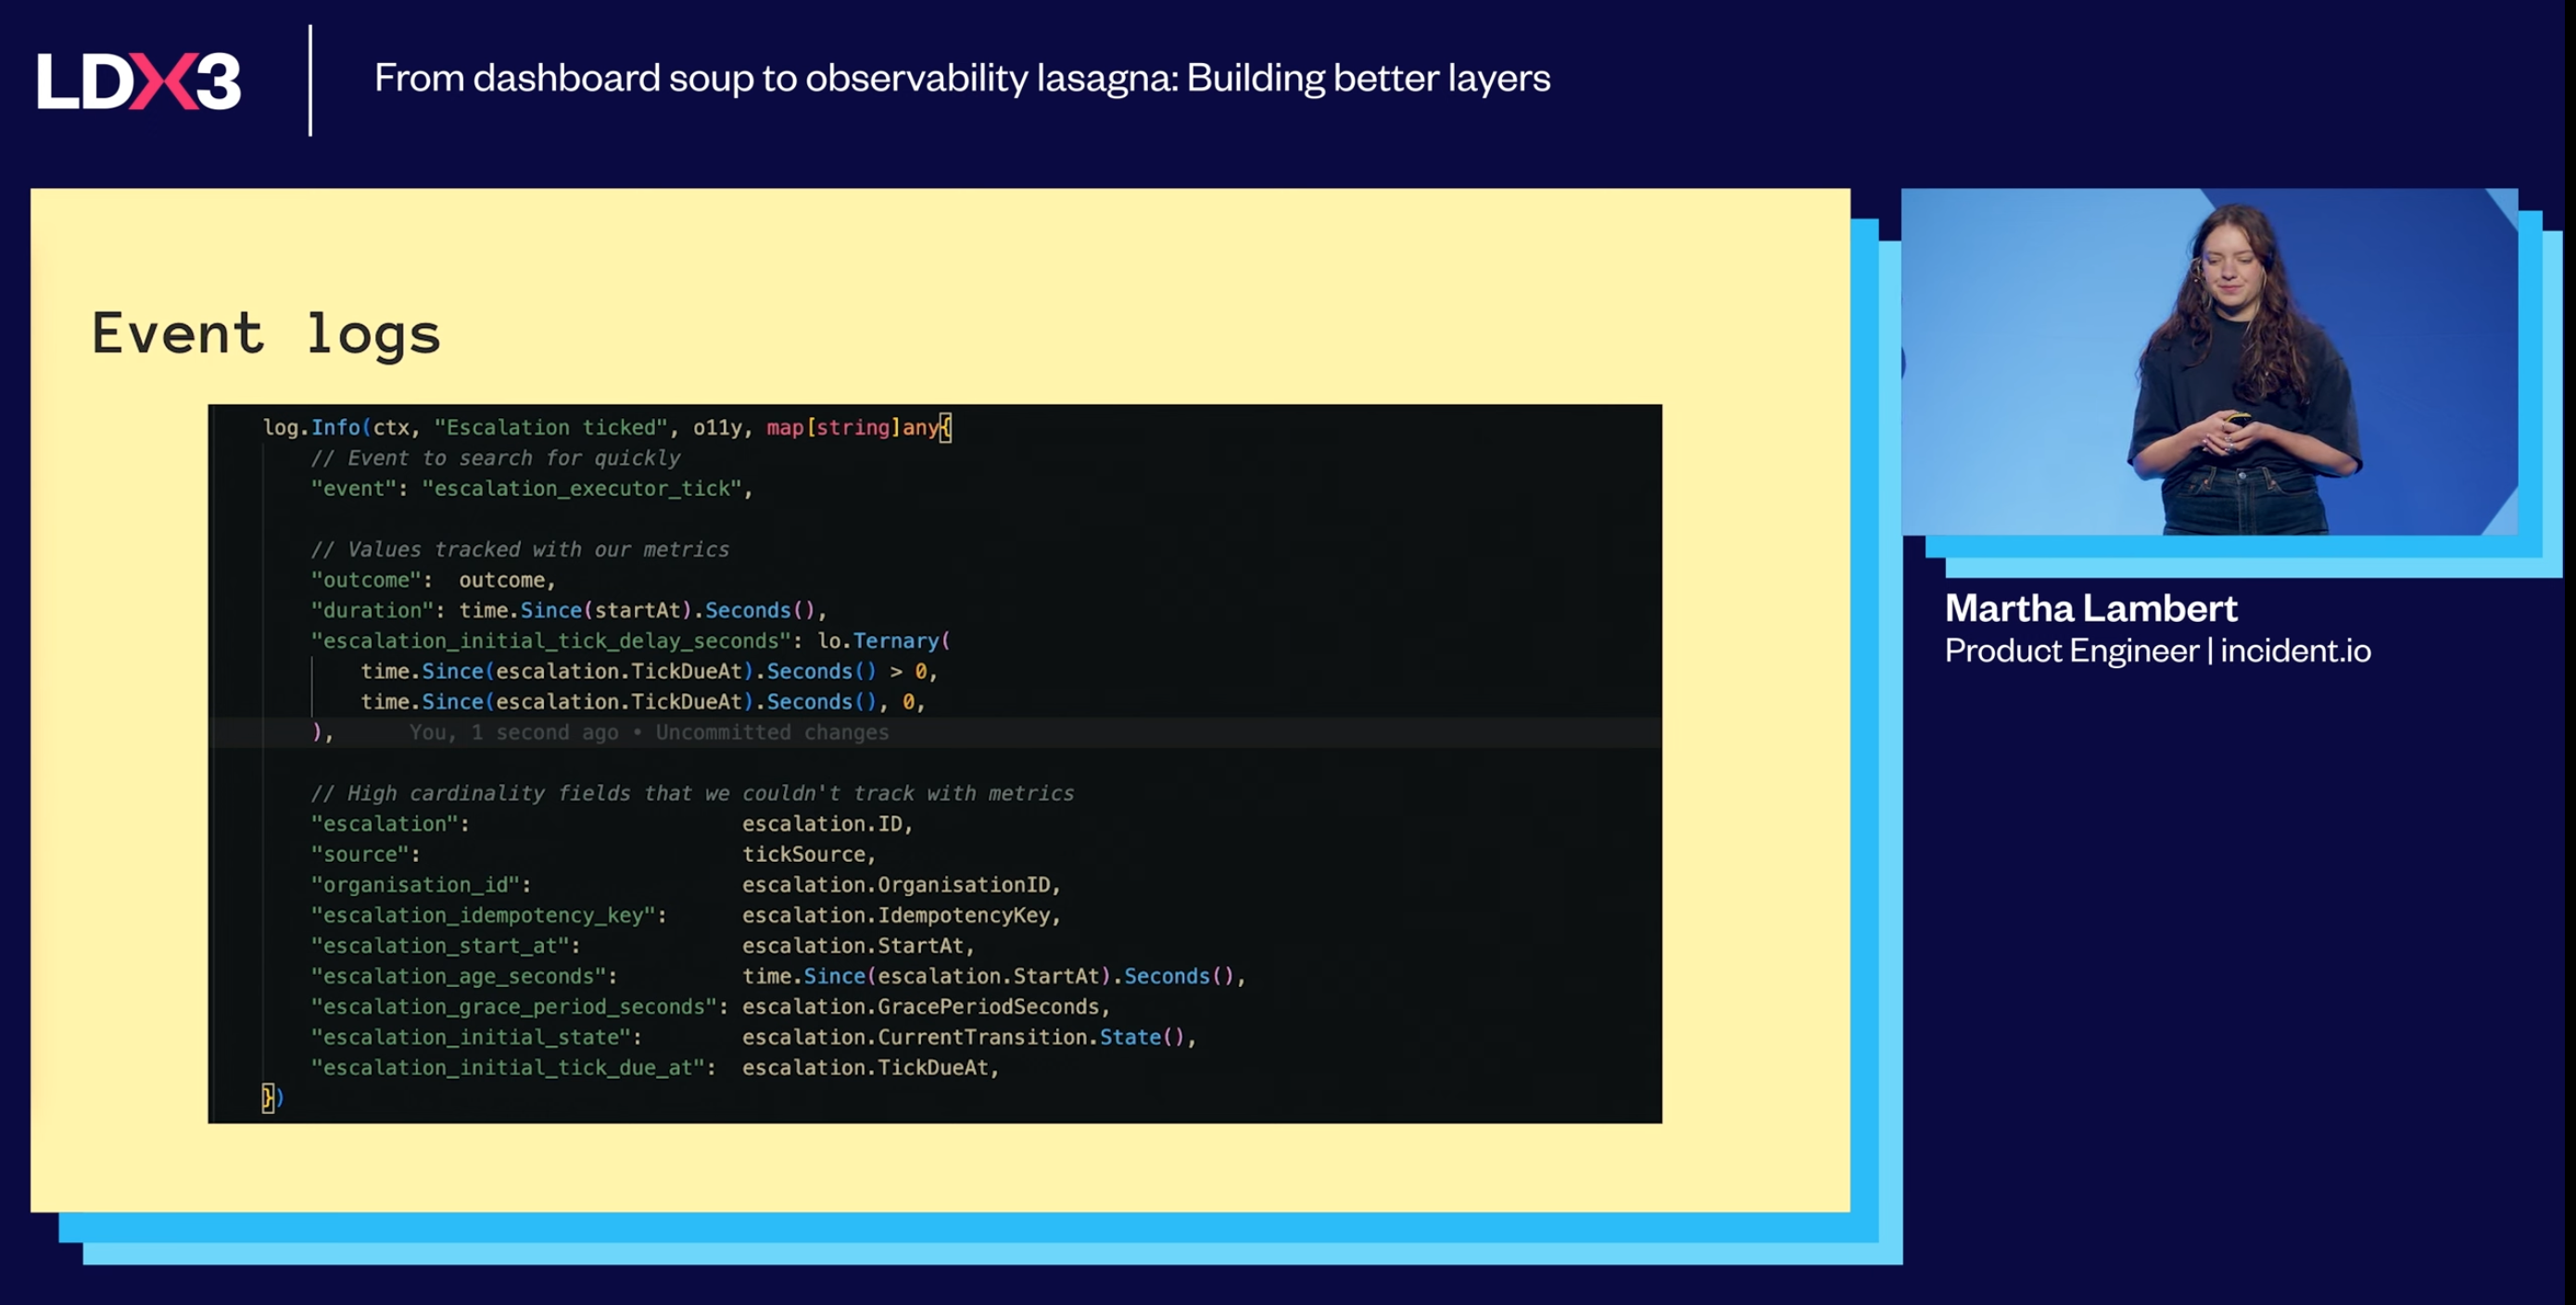
An example of a structured event.
Tips
- Key metric observed user response time for a request
- Connect metrics and logs through structured events
- Always log event during panics / crashes
- Visualize service limits
- Do game days that use the observability tooling to look into an issue (they do quarterly)