- Short talk that reminded me about how to be methodical about investigation performance issues
- USE: Resource centric, Brendan Gregg, utilization + saturation + errors of underlying servers
- RED: App centric, Tom Wilke, Rate + errors + duration
- Golden Signals: App centric as well (Overlap with RED), from the SRE book, traffic volume + errors + latency + saturation
- Random googling is not always your friend :)
- Percona has a tool that automates USE metric collection
- source
G1: To Infinity and Beyond
- Speaker: Stefan Johansson
-
source
- Collectors can optimize for 1 or a few of
- Throughput
- Latency
- Memory footprint
- G1 tries to achieve a balance between them (zgc goes for low latency … sub 1ms pause times achieved!)
- G1 is the default collector in jdk 9+
- Goal: avoid full collections
- Try to do bulk of work outside full gc span during concurrent steps
- G1 has improved a lot since jdk8 (1000+ patches to this collector)
- Big improvements in jdk11 + jdk17
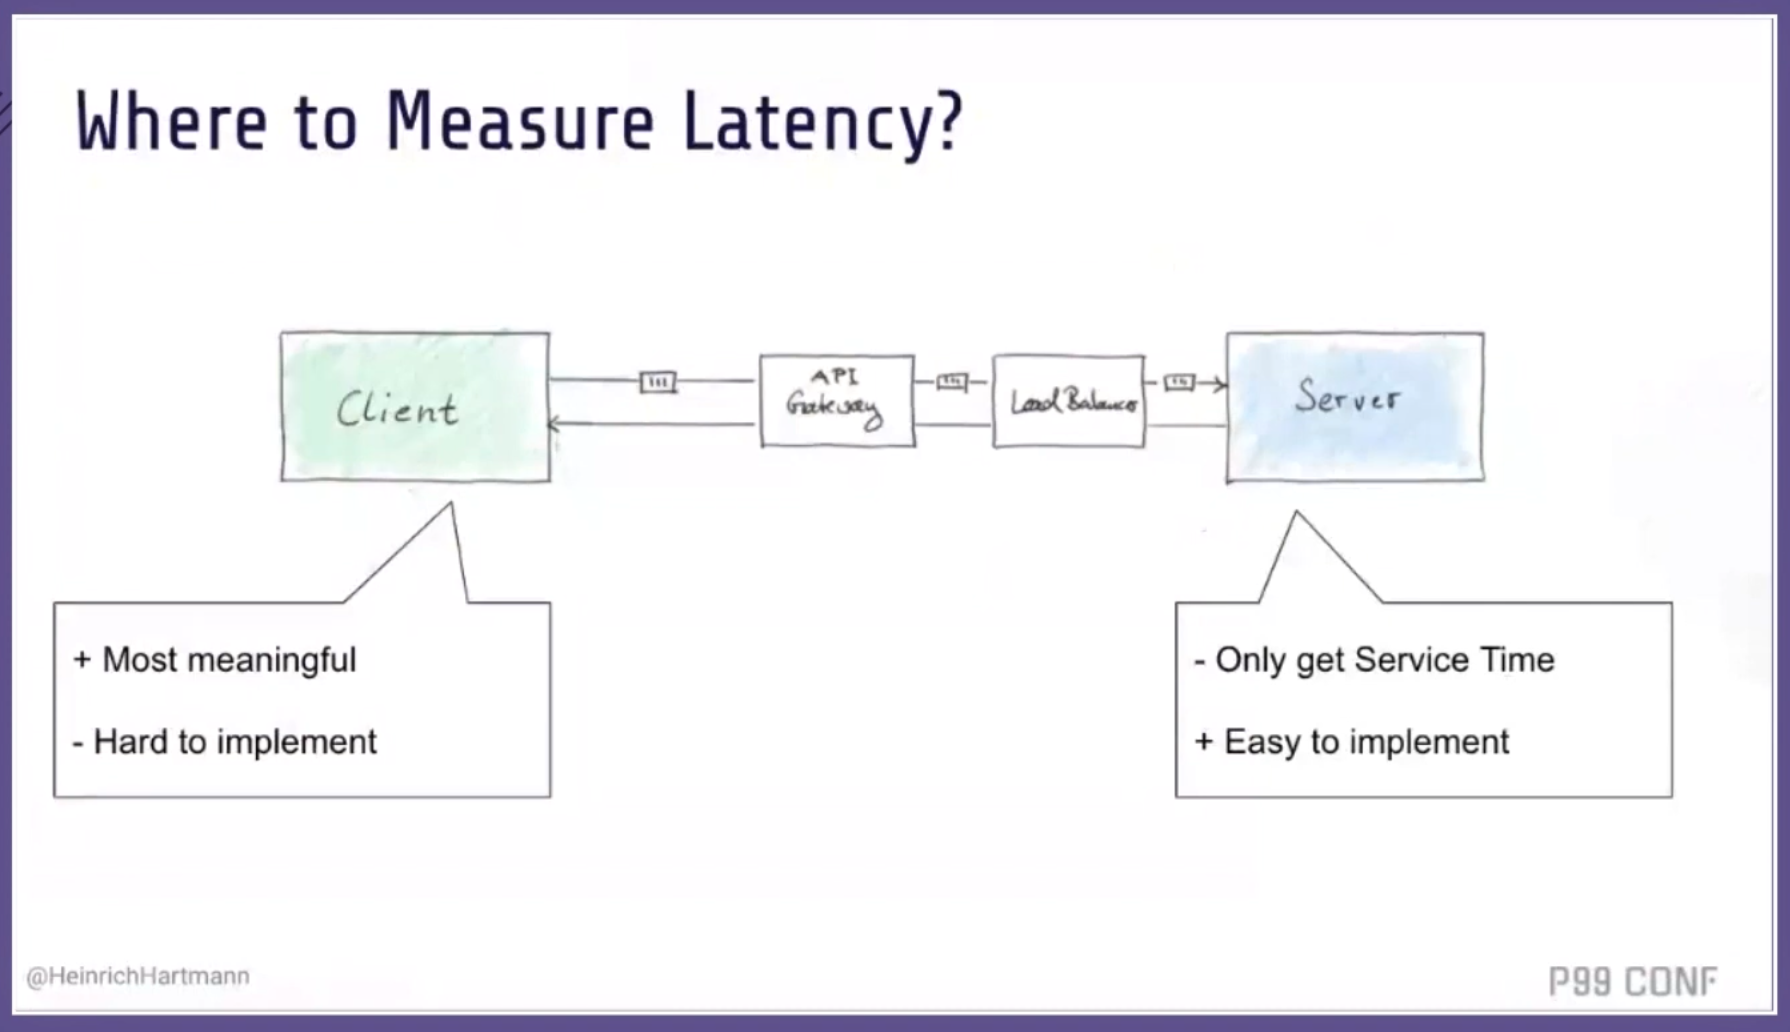
- Different between response time vs service time
- Measuring only on the server is insufficient (service time)
- But this is where we often start because it’s easy
- Only measuring here does not correlate with user experience
- It hides queuing and other issues in components between the client and backend
- Measuring at the client gives us more information but isn’t the full story either
- You have to do both to be able to reason about some of the things happening in between
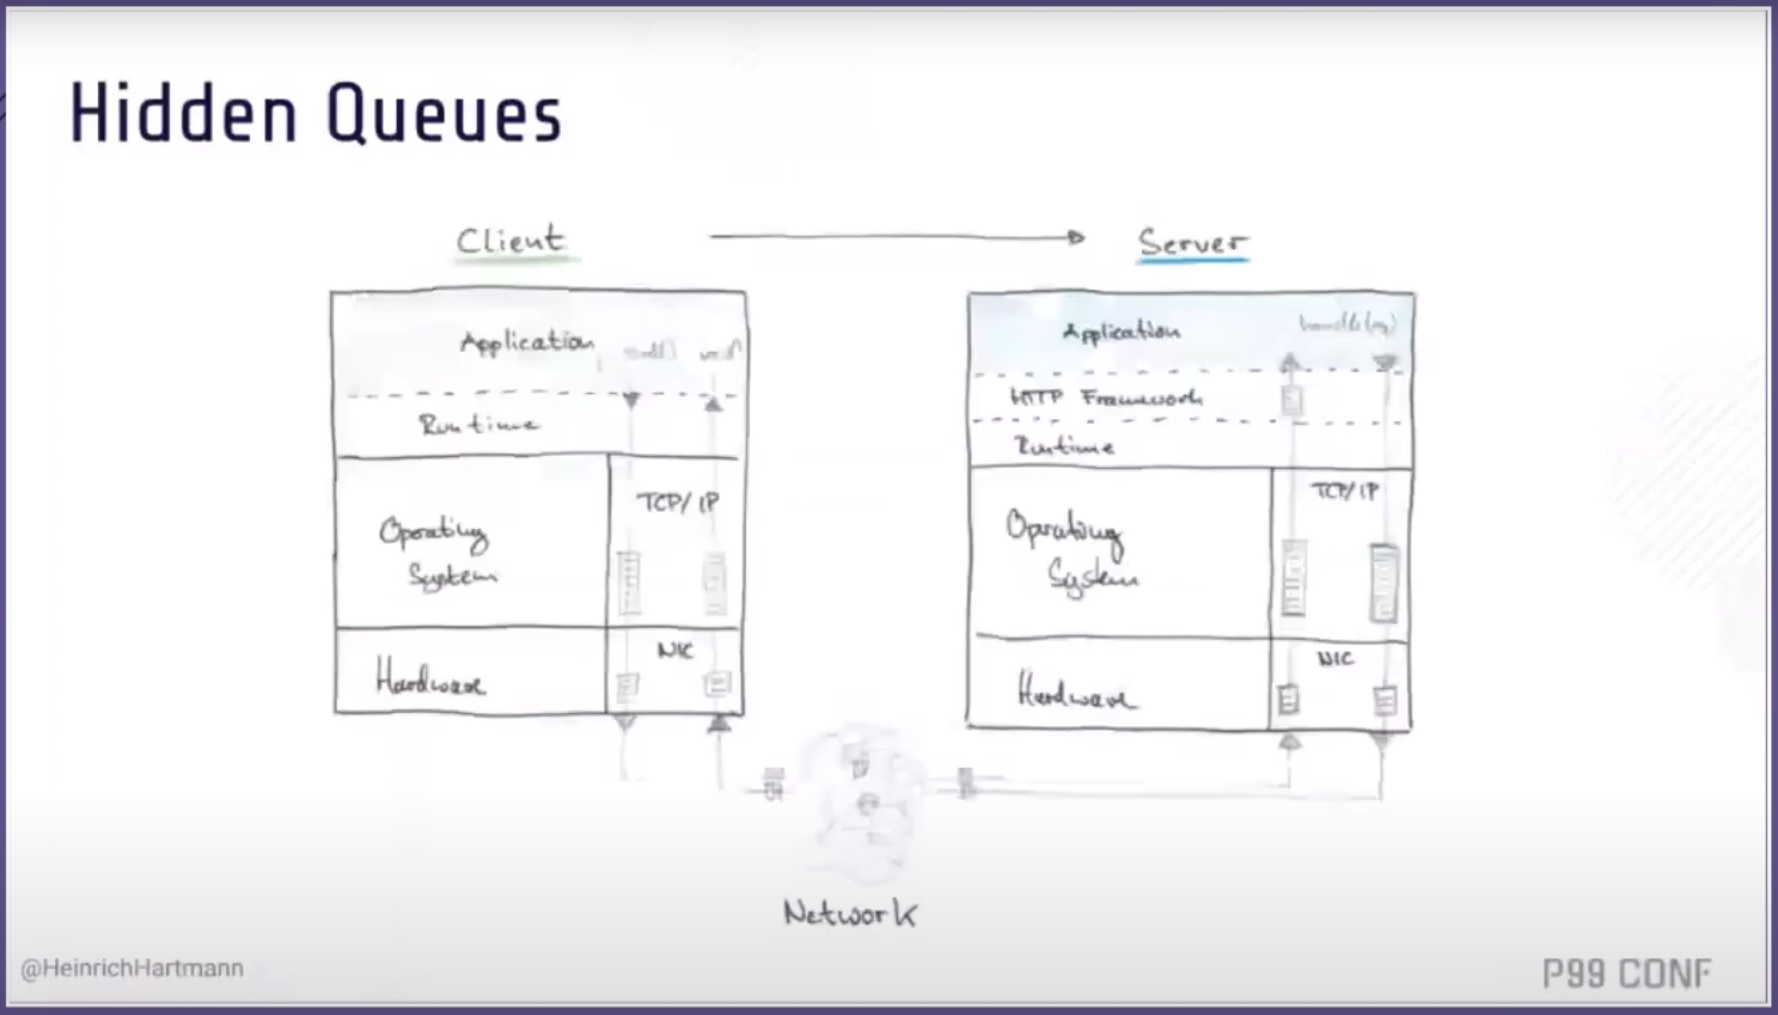
- Queuing! Queues are everywhere and represent things / people waiting for access to a resource


